

Punjab ranked 4th in May GST collection; India’s gross GST revenue collection records 10% y-o-y growth
Kanwar Inder Singh/ royalpatiala.in News/ June 1,2024
Punjab has ranked 4th in the collection of GST in May, with 26 percent growth.
Manipur topped the May GST collection with 48 percent followed by Delhi with 46 percent, Uttrakhand and Haryana with 28 percent each .
The gross Goods and Services Tax (GST) revenue for the month of May 2024 stood at Rs. 1.73 lakh crore. This represents a 10% year-on-year growth, driven by a strong increase in domestic transactions (up 15.3%) and slowing of imports (down 4.3%). After accounting for refunds, the net GST revenue for May 2024 stands at Rs. 1.44 lakh crore, reflecting a growth of 6.9% compared to the same period last year.
Breakdown of May 2024 Collections:
- Central Goods and Services Tax (CGST): Rs. 32,409 crore;
- State Goods and Services Tax (SGST): Rs. 40,265 crore;
- Integrated Goods and Services Tax (IGST): Rs. 87,781 crore, including Rs. 39,879 crore collected on imported goods;
- Cess: Rs. 12,284 crore, including Rs. 1,076 crore collected on imported goods.
The gross GST collections in the FY 2024-25 till May 2024 stood at Rs. 3.83 lakh crore. This represents an impressive 11.3% year-on-year growth, driven by a strong increase in domestic transactions (up 14.2%) and marginal increase in imports (up 1.4%). After accounting for refunds, the net GST revenue in the FY 2024-25 till May 2024 stands at Rs. 3.36 lakh crore, reflecting a growth of 11.6% compared to the same period last year.
Breakdown of collections in the FY 2024-25 till May, 2024, are as below:
- Central Goods and Services Tax (CGST): Rs. 76,255 crore;
- State Goods and Services Tax (SGST): Rs. 93,804 crore;
- Integrated Goods and Services Tax (IGST): Rs. 1,87,404 crore, including Rs. 77,706 crore collected on imported goods;
- Cess: Rs. 25,544 crore, including Rs. 2,084 crore collected on imported goods.
Inter-Governmental Settlement:
In the month of May, 2024, the Central Government settled Rs. 38,519 crore to CGST and Rs. 32,733 crore to SGST from the net IGST collected of Rs. 67,204 crore. This translates to a total revenue of Rs. 70,928 crore for CGST and Rs. 72,999 crore for SGST in May, 2024, after regular settlement.
Similarly, in the FY 2024-25 till May 2024 the Central Government settled Rs. 88,827 crore to CGST and Rs. 74,333 crore to SGST from the net IGST collected of Rs. 154,671 crore. This translates to a total revenue of Rs. 1,65,081 crore for CGST and Rs. 1,68,137 crore for SGST in FY 2024-25 till May 2024 after regular settlement.
The chart below shows trends in monthly gross GST revenues during the current year. Table-1 shows the state-wise figures of GST collected in each State during the month of May, 2024 as compared to May, 2023. Table-2 shows the state-wise figures of post settlement GST revenue of each State for the month of May, 2024.
Chart: Trends in GST Collection
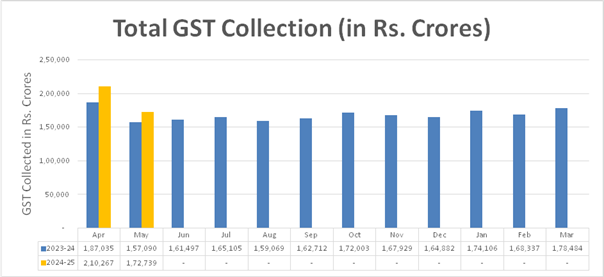
Table 1: State-wise growth of GST Revenues during May, 2024
| State/UT | May-23 | May-24 | Growth (%) |
| Jammu and Kashmir | 422 | 525 | 24% |
| Himachal Pradesh | 828 | 838 | 1% |
| Punjab | 1,744 | 2,190 | 26% |
| Chandigarh | 259 | 237 | -9% |
| Uttarakhand | 1,431 | 1,837 | 28% |
| Haryana | 7,250 | 9,289 | 28% |
| Delhi | 5,147 | 7,512 | 46% |
| Rajasthan | 3,924 | 4,414 | 13% |
| Uttar Pradesh | 7,468 | 9,091 | 22% |
| Bihar | 1,366 | 1,521 | 11% |
| Sikkim | 334 | 312 | -7% |
| Arunachal Pradesh | 120 | 98 | -18% |
| Nagaland | 52 | 45 | -14% |
| Manipur | 39 | 58 | 48% |
| Mizoram | 38 | 39 | 3% |
| Tripura | 75 | 73 | -3% |
| Meghalaya | 214 | 172 | -20% |
| Assam | 1,217 | 1,228 | 1% |
| West Bengal | 5,162 | 5,377 | 4% |
| Jharkhand | 2,584 | 2,700 | 4% |
| Odisha | 4,398 | 5,027 | 14% |
| Chhattisgarh | 2,525 | 2,853 | 13% |
| Madhya Pradesh | 3,381 | 3,402 | 1% |
| Gujarat | 9,800 | 11,325 | 16% |
| Dadra and Nagar Haveli and Daman & Diu | 324 | 375 | 16% |
| Maharashtra | 23,536 | 26,854 | 14% |
| Karnataka | 10,317 | 11,889 | 15% |
| Goa | 523 | 519 | -1% |
| Lakshadweep | 2 | 1 | -39% |
| Kerala | 2,297 | 2,594 | 13% |
| Tamil Nadu | 8,953 | 9,768 | 9% |
| Puducherry | 202 | 239 | 18% |
| Andaman and Nicobar Islands | 31 | 37 | 18% |
| Telangana | 4,507 | 4,986 | 11% |
| Andhra Pradesh | 3,373 | 3,890 | 15% |
| Ladakh | 26 | 15 | -41% |
| Other Territory | 201 | 207 | 3% |
| Center Jurisdiction | 187 | 245 | 30% |
| Grand Total | 1,14,261 | 1,31,783 | 15% |
Table-2: SGST & SGST portion of IGST settled to States/UTs in May (Rs. in crore)
| Pre-Settlement SGST | Post-Settlement SGST[2] | |||||
| State/UT | May-23 | May-24 | Growth | May-23 | May-24 | Growth |
| Jammu and Kashmir | 178 | 225 | 26% | 561 | 659 | 17% |
| Himachal Pradesh | 189 | 187 | -1% | 435 | 436 | 0% |
| Punjab | 638 | 724 | 14% | 1,604 | 1,740 | 8% |
| Chandigarh | 48 | 54 | 12% | 168 | 178 | 6% |
| Uttarakhand | 411 | 476 | 16% | 666 | 714 | 7% |
| Haryana | 1,544 | 1,950 | 26% | 2,568 | 3,025 | 18% |
| Delhi | 1,295 | 1,477 | 14% | 2,539 | 2,630 | 4% |
| Rajasthan | 1,386 | 1,506 | 9% | 3,020 | 3,315 | 10% |
| Uttar Pradesh | 2,384 | 2,736 | 15% | 5,687 | 6,848 | 20% |
| Bihar | 623 | 695 | 11% | 2,058 | 2,298 | 12% |
| Sikkim | 31 | 26 | -15% | 84 | 66 | -21% |
| Arunachal Pradesh | 60 | 45 | -26% | 187 | 152 | -19% |
| Nagaland | 21 | 19 | -9% | 83 | 79 | -4% |
| Manipur | 23 | 32 | 35% | 77 | 107 | 39% |
| Mizoram | 21 | 22 | 3% | 79 | 77 | -3% |
| Tripura | 40 | 36 | -9% | 135 | 138 | 2% |
| Meghalaya | 56 | 52 | -7% | 158 | 154 | -3% |
| Assam | 488 | 511 | 5% | 1,170 | 1,280 | 9% |
| West Bengal | 1,952 | 2,030 | 4% | 3,407 | 3,628 | 6% |
| Jharkhand | 653 | 735 | 13% | 976 | 1,135 | 16% |
| Odisha | 1,255 | 1,415 | 13% | 1,676 | 2,068 | 23% |
| Chhattisgarh | 583 | 661 | 14% | 833 | 1,033 | 24% |
| Madhya Pradesh | 987 | 1,028 | 4% | 2,580 | 2,555 | -1% |
| Gujarat | 3,371 | 3,526 | 5% | 5,156 | 5,233 | 2% |
| Dadra and Nagar Haveli and Daman and Diu | 47 | 58 | 23% | 92 | 80 | -13% |
| Maharashtra | 7,621 | 8,711 | 14% | 10,952 | 12,397 | 13% |
| Karnataka | 3,022 | 3,441 | 14% | 5,704 | 6,062 | 6% |
| Goa | 182 | 190 | 4% | 324 | 321 | -1% |
| Lakshadweep | 0 | 1 | 478% | 7 | 5 | -35% |
| Kerala | 1,040 | 1,209 | 16% | 2,387 | 2,497 | 5% |
| Tamil Nadu | 3,101 | 3,530 | 14% | 4,829 | 6,014 | 25% |
| Puducherry | 36 | 41 | 13% | 99 | 106 | 7% |
| Andaman and Nicobar Islands | 15 | 18 | 17% | 41 | 44 | 5% |
| Telangana | 1,448 | 1,636 | 13% | 3,024 | 3,239 | 7% |
| Andhra Pradesh | 1,048 | 1,240 | 18% | 2,116 | 2,597 | 23% |
| Ladakh | 14 | 8 | -43% | 34 | 24 | -27% |
| Other Territory | 16 | 17 | 8% | 83 | 66 | -20% |
| Grand Total | 35,828 | 40,265 | 12% | 65,597 | 72,999 | 11% |


)